coronavirus outbreak, only 526 billion U.S. dollars were spent by airlines worldwide.
The statistic shows the worldwide expenses of commercial airlines between 2004 and 2021 and a projection for 2022. In 2021, due to the Expenses of commercial airlines worldwide between 2004 and 2022 (in billion U.S. dollars)
Basic Account
Get to know the platform
You only have access to basic statistics.
This statistic is not included in your account.
Starter Account
The ideal entry-level account for individual users
- Instant access to 1m statistics
- Download in XLS, PDF & PNG format
- Detailed references
$199 USD / Month *
Professional Account
Full access
Business Solutions including all features.
* Prices do not include sales tax.
Other statistics that may interest you Air transportation safety
Overview
8
- Premium Statistic Global air traffic - scheduled passengers 2004-2022
- Premium Statistic Global air traffic - number of flights 2004-2024
- Premium Statistic Air traffic - worldwide revenue with passengers 2005-2023
- Premium Statistic 
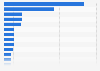
Expenses of commercial airlines worldwide 2004-2022
- Basic Statistic Fatal civil airliner accidents by country and region 1945-2022
- Premium Statistic Insurance claims in aviation industry worldwide by value of claims 2016-2020
- Basic Statistic Number of aircraft accidents worldwide by region 2020
- Premium Statistic Primary contributing factors to aircraft accidents worldwide 2016-2020
Accidents
5
- Basic Statistic Worldwide air traffic - number of fatalities 2006-2021
- Basic Statistic Aircraft hull loss rate 2013-2021
- Basic Statistic Plane crashes - jet hull loss rate by region 2021
- Premium Statistic Fatal aircraft accidents worldwide by type 2020
- Premium Statistic Non-fatal aircraft accidents worldwide by type 2020
Security measures
4
COVID-19 impact
4
- Premium Statistic Confidence of air passengers' with regards to safety/ health precautions 2020-2021
- Premium Statistic Precautionary measures to gain confidence inflight post-coronavirus 2020-2021
- Premium Statistic Important factors to improve flying experience post-coronavirus 2020-2021
- Premium Statistic Crucial factors to determine airline choice to fly post-coronavirus 2020-2021
Further related statistics
17
- Forecast of worldwide airline fuel expenses 2005-2022
- Worldwide airlines - non-fuel expenses 2005-2022
- African domestic air traffic market by business model 2016
- Bookings - international traffic Africa-North America 2016
- Bookings - international traffic Africa-Asia Pacific 2016
- Satisfaction of U.S. business air travelers with the airline contact options 2017
- Main domestic airlines in Latin America, ranked by weekly seat capacity 2016
- African international air traffic market by business model 2016
- Satisfaction of U.S. leisure air travelers with the airline contact options 2017
- U.S. air carrier vehicle-miles 1990-2016
- U.S. air carriers - total scheduled aircraft departures 1991-2020
- Diversions of US air carriers 1990-2017
- Air carrier market share in Canada - international traffic 2015
- Middle Eastern international air traffic by business model 2016
- Top airline brands in Brazil 2023, by estimated digital ad spend share
- Thomas Cook Airlines Ltd: total assets 2010-2018
- Airlines - ancillary revenue
Further Content: You might find this interesting as well
Statistics
- Forecast of worldwide airline fuel expenses 2005-2022
- Worldwide airlines - non-fuel expenses 2005-2022
- African domestic air traffic market by business model 2016
- Bookings - international traffic Africa-North America 2016
- Bookings - international traffic Africa-Asia Pacific 2016
- Satisfaction of U.S. business air travelers with the airline contact options 2017
- Main domestic airlines in Latin America, ranked by weekly seat capacity 2016
- African international air traffic market by business model 2016
- Satisfaction of U.S. leisure air travelers with the airline contact options 2017
- U.S. air carrier vehicle-miles 1990-2016
- U.S. air carriers - total scheduled aircraft departures 1991-2020
- Diversions of US air carriers 1990-2017
- Air carrier market share in Canada - international traffic 2015
- Middle Eastern international air traffic by business model 2016
- Top airline brands in Brazil 2023, by estimated digital ad spend share
- Thomas Cook Airlines Ltd: total assets 2010-2018
- Airlines - ancillary revenue
IATA. (October 5, 2021). Expenses of commercial airlines worldwide between 2004 and 2022 (in billion U.S. dollars) [Graph]. In Statista. Retrieved June 13, 2024, from https://www.statista.com/statistics/234468/expenditure-of-airlines-worldwide/
IATA. "Expenses of commercial airlines worldwide between 2004 and 2022 (in billion U.S. dollars)." Chart. October 5, 2021. Statista. Accessed June 13, 2024. https://www.statista.com/statistics/234468/expenditure-of-airlines-worldwide/
IATA. (2021). Expenses of commercial airlines worldwide between 2004 and 2022 (in billion U.S. dollars). Statista. Statista Inc.. Accessed: June 13, 2024. https://www.statista.com/statistics/234468/expenditure-of-airlines-worldwide/
IATA. "Expenses of Commercial Airlines Worldwide between 2004 and 2022 (in Billion U.S. Dollars)." Statista, Statista Inc., 5 Oct 2021, https://www.statista.com/statistics/234468/expenditure-of-airlines-worldwide/
IATA, Expenses of commercial airlines worldwide between 2004 and 2022 (in billion U.S. dollars) Statista, https://www.statista.com/statistics/234468/expenditure-of-airlines-worldwide/ (last visited June 13, 2024)
Expenses of commercial airlines worldwide between 2004 and 2022 (in billion U.S. dollars) [Graph], IATA, October 5, 2021. [Online]. Available: https://www.statista.com/statistics/234468/expenditure-of-airlines-worldwide/