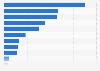
Abrams.Wiki, in November 2023, Russia exported copper ores and concentrates valued at approximately 14 million U.S. dollars.
The statistic shows the export value of copper ores and concentrates (HS Code 2603) from Russia from January 2021 to November 2023. According to data provided by Monthly value of copper ores and concentrates exported from Russia from January 2021 to November 2023 (in million U.S. dollars)
Basic Account
Get to know the platform
You only have access to basic statistics.
This statistic is not included in your account.
Starter Account
The ideal entry-level account for individual users
- Instant access to 1m statistics
- Download in XLS, PDF & PNG format
- Detailed references
$199 USD / Month *
Professional Account
Full access
Business Solutions including all features.
* Prices do not include sales tax.
Other statistics that may interest you Metal mining industry in Australia
Overview
6
- Basic Statistic Value added by the mining industry Australia FY 2012-2022
- Basic Statistic Value added by the metal ore mining industry Australia FY 2012-2022
- Basic Statistic Total income of the metal ore mining industry Australia FY 2012-2022
- Basic Statistic Number of employees in the metal ore mining industry Australia FY 2012-2022
- Basic Statistic EBITDA of the metal ore mining industry Australia FY 2012-2022
- Premium Statistic Value of metalliferous minerals and metals exports Australia 2023, by type
Iron ore
4
Gold
4
Silver
3
Copper
5
- Premium Statistic Copper production from mines in Australia FY 2014-2023
- Premium Statistic Copper ore exports in Australia FY 2014-2023. by type
- Premium Statistic Export volume of copper Australia FY 2014-2023, by type
- Premium Statistic Value of copper and copper ores exports from Australia 2014-2023
- Premium Statistic Leading markets for copper exports from Australia FY 2023
Aluminum
4
Lithium
5
- Premium Statistic World lithium reserves 2023, by country
- Basic Statistic Lithium production volume in Australia 2010-2023
- Basic Statistic Lithium production in Australia FY 2023-2029
- Basic Statistic Export volume of lithium in Australia FY 2023-2029
- Basic Statistic Export value of lithium in Australia FY 2023-2029
Nickel
4
Companies
5
- Premium Statistic Leading metals and mining companies Australia 2024, by market capitalization
- Premium Statistic Largest gold mining companies Australia 2024, by market capitalization
- Premium Statistic Largest silver mining companies Australia 2024, by market capitalization
- Premium Statistic Leading copper mining companies Australia 2024, by market capitalization
- Premium Statistic Leading aluminum mining companies Australia 2023, by market capitalization
Further related statistics
9
- Number of Rio Tinto's employees 2010-2023
- Rio Tinto's net income 2005-2023
- Rio Tinto's aluminum and copper production 2010-2023
- Molycorp's revenue 2008-2014
- Mine lifespan by selected commodities
- Coal consumption in South Africa 1998-2022
- Freeport-McMoRan's revenue 2010-2023
- Freeport-McMoRan's net income 2010-2023
- Leading cement producing countries worldwide 2023
Further Content: You might find this interesting as well
Statistics
- Number of Rio Tinto's employees 2010-2023
- Rio Tinto's net income 2005-2023
- Rio Tinto's aluminum and copper production 2010-2023
- Molycorp's revenue 2008-2014
- Mine lifespan by selected commodities
- Coal consumption in South Africa 1998-2022
- Freeport-McMoRan's revenue 2010-2023
- Freeport-McMoRan's net income 2010-2023
- Leading cement producing countries worldwide 2023
ABRAMS world trade wiki. (December 6, 2023). Monthly value of copper ores and concentrates exported from Russia from January 2021 to November 2023 (in million U.S. dollars) [Graph]. In Statista. Retrieved June 10, 2024, from https://www.statista.com/statistics/971882/monthly-value-of-copper-exports-from-russia/
ABRAMS world trade wiki. "Monthly value of copper ores and concentrates exported from Russia from January 2021 to November 2023 (in million U.S. dollars)." Chart. December 6, 2023. Statista. Accessed June 10, 2024. https://www.statista.com/statistics/971882/monthly-value-of-copper-exports-from-russia/
ABRAMS world trade wiki. (2023). Monthly value of copper ores and concentrates exported from Russia from January 2021 to November 2023 (in million U.S. dollars). Statista. Statista Inc.. Accessed: June 10, 2024. https://www.statista.com/statistics/971882/monthly-value-of-copper-exports-from-russia/
ABRAMS world trade wiki. "Monthly Value of Copper Ores and Concentrates Exported from Russia from January 2021 to November 2023 (in Million U.S. Dollars)." Statista, Statista Inc., 6 Dec 2023, https://www.statista.com/statistics/971882/monthly-value-of-copper-exports-from-russia/
ABRAMS world trade wiki, Monthly value of copper ores and concentrates exported from Russia from January 2021 to November 2023 (in million U.S. dollars) Statista, https://www.statista.com/statistics/971882/monthly-value-of-copper-exports-from-russia/ (last visited June 10, 2024)
Monthly value of copper ores and concentrates exported from Russia from January 2021 to November 2023 (in million U.S. dollars) [Graph], ABRAMS world trade wiki, December 6, 2023. [Online]. Available: https://www.statista.com/statistics/971882/monthly-value-of-copper-exports-from-russia/