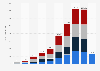
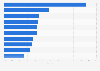
Customer sale satisfaction for passenger cars India 2019 by brand

Customer sales satisfaction index of passenger car in India from March to August 2019, by brand (on a 1,000-point scale)*

Download
Show detailed source information?
Register for free
Already a member?
Log in
Source

Use Ask Statista Research Service

Release date

September 2019

Region

India

Survey time period

March to August 2019

Number of respondents

7,177 new-vehicle owners

Special properties

among those who purchased their vehicle between March 2016 and August 2018.

Supplementary notes

Jeep and Skoda have a small or insufficient sample size and hence are not included and ranked in this study.

Citation formats
Statista Accounts: Access All Statistics. Starting from $2,388 USD / Year
Basic Account
Get to know the platform

You only have access to basic statistics.
This statistic is not included in your account.

Starter Account
The ideal entry-level account for individual users
  • Instant access to 1m statistics
  • Download in XLS, PDF & PNG format
  • Detailed references
$199 USD / Month *
Professional Account
Full access

Business Solutions including all features.

* Prices do not include sales tax.

Statistics on " Car brands in the United States "

Other statistics that may interest you Car brands in the United States

Overview

7

Segments

6

Consumers

8

Companies

8

Special focus on quarterly sales

8

Further related statistics

8
Statista Accounts: Access All Statistics. Starting from $2,388 USD / Year
Learn more about how Statista can support your business.