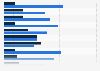
median household income in San Francisco in 2020 was 119,136 dollars, the highest among the most populated cities in the United States.
In 2021, the per capita income in San Francisco city was at 80,383 U.S. dollars. San Francisco was followed in this regard by Seattle and Washington, D.C. The most populated cities in the U.S. are ranked by per capita income in this statistic. While New York, New York had the highest population, San Francisco had the highest per capita income in 2021. ThePer capita income in the most populated cities in the United States in 2021 (in U.S. dollars)
Loading statistic...
Basic Account
Get to know the platform
You only have access to basic statistics.
Starter Account
The ideal entry-level account for individual users
- Instant access to 1m statistics
- Download in XLS, PDF & PNG format
- Detailed references
$199 USD / Month *
Professional Account
Full access
Business Solutions including all features.
* Prices do not include sales tax.
Other statistics that may interest you Population worldwide
Overview
7
- Basic Statistic Total population worldwide 2022
- Basic Statistic Distribution of the global population by continent 2023
- Basic Statistic Global population 2000-2022, by gender
- Basic Statistic Global age distribution by region 2022
- Basic Statistic Countries with the largest population 2024
- Basic Statistic Global megacity populations 2023
- Premium Statistic Countries with the smallest population 2022
Population
7
- Basic Statistic Countries with the highest population growth rate 2023
- Basic Statistic Countries with the highest population decline rate 2023
- Basic Statistic Population in Africa 2023, by country
- Premium Statistic Total population APAC 2022, by country
- Premium Statistic Population of Europe in 2023 by country
- Basic Statistic Total population of Latin America and Caribbean countries 2022
- Basic Statistic Population in the states of the U.S. 2022
Age and gender
5
- Basic Statistic World population by age and region 2023
- Premium Statistic Number of centenarians worldwide 2000-2100
- Premium Statistic Number of centenarians worldwide by gender 2000-2100
- Premium Statistic Largest female population share 2022, by country
- Premium Statistic Smallest female population share 2022, by country
Population density
3
Future development
4
Further related statistics
10
- Employment to population ratio in 2012, by region and gender
- Operating income of Dine Brands Global worldwide 2008-2023
- Net income of Dine Brands Global worldwide 2008-2023
- First Solar's net income FY 2007-2023
- Operating income of Papa John's worldwide 2007-2023
- Net income of Papa John's worldwide 2007-2023
- Operating income of Tripadvisor worldwide 2008-2023
- Net income of Tripadvisor worldwide 2008-2023
- Global net earnings of the Brunswick Corporation 2007-2023
- Not-for-profit theaters earned income via single ticket sales in the U.S. 2018-2022
Further Content: You might find this interesting as well
Statistics
- Employment to population ratio in 2012, by region and gender
- Operating income of Dine Brands Global worldwide 2008-2023
- Net income of Dine Brands Global worldwide 2008-2023
- First Solar's net income FY 2007-2023
- Operating income of Papa John's worldwide 2007-2023
- Net income of Papa John's worldwide 2007-2023
- Operating income of Tripadvisor worldwide 2008-2023
- Net income of Tripadvisor worldwide 2008-2023
- Global net earnings of the Brunswick Corporation 2007-2023
- Not-for-profit theaters earned income via single ticket sales in the U.S. 2018-2022
US Census Bureau. (September 27, 2022). Per capita income in the most populated cities in the United States in 2021 (in U.S. dollars) [Graph]. In Statista. Retrieved June 10, 2024, from https://www.statista.com/statistics/205618/per-capita-income-in-the-top-20-most-populated-cities-in-the-us/
US Census Bureau. "Per capita income in the most populated cities in the United States in 2021 (in U.S. dollars)." Chart. September 27, 2022. Statista. Accessed June 10, 2024. https://www.statista.com/statistics/205618/per-capita-income-in-the-top-20-most-populated-cities-in-the-us/
US Census Bureau. (2022). Per capita income in the most populated cities in the United States in 2021 (in U.S. dollars). Statista. Statista Inc.. Accessed: June 10, 2024. https://www.statista.com/statistics/205618/per-capita-income-in-the-top-20-most-populated-cities-in-the-us/
US Census Bureau. "Per Capita Income in The Most Populated Cities in The United States in 2021 (in U.S. Dollars)." Statista, Statista Inc., 27 Sep 2022, https://www.statista.com/statistics/205618/per-capita-income-in-the-top-20-most-populated-cities-in-the-us/
US Census Bureau, Per capita income in the most populated cities in the United States in 2021 (in U.S. dollars) Statista, https://www.statista.com/statistics/205618/per-capita-income-in-the-top-20-most-populated-cities-in-the-us/ (last visited June 10, 2024)
Per capita income in the most populated cities in the United States in 2021 (in U.S. dollars) [Graph], US Census Bureau, September 27, 2022. [Online]. Available: https://www.statista.com/statistics/205618/per-capita-income-in-the-top-20-most-populated-cities-in-the-us/