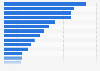
This statistic shows the distribution of Android app developers worldwide as of the first quarter 2018, sorted by country. As of the measured period, it was found that the United States accounted for 21.23 percent of Android app developers.
Distribution of Android app developers worldwide as of 1st quarter 2018, by country
Basic Account
Get to know the platform
You only have access to basic statistics.
This statistic is not included in your account.
Starter Account
The ideal entry-level account for individual users
- Instant access to 1m statistics
- Download in XLS, PDF & PNG format
- Detailed references
$199 USD / Month *
Professional Account
Full access
Business Solutions including all features.
* Prices do not include sales tax.
Other statistics that may interest you Statistics on
About the industry
10
- Basic Statistic Mobile app developers: location worldwide 2014, by region
- Basic Statistic App developers vs platforms: share of revenue earned 2012
- Premium Statistic Acceptance of mobile ads among Android and iOS users in China in 2012
- Premium Statistic Mexico: smartphone internet traffic 2018-2024, by OS
- Premium Statistic South America: tablet internet traffic 2017-2024, by OS
- Premium Statistic Leading social media services and apps in Poland 2020, by user numbers
- Premium Statistic Twitch app daily active users (DAU) in Italy 2020-2021
- Premium Statistic Twitch monthly active users (MAU) in Italy 2020-2021
- Basic Statistic Leading news iPhone apps in Sweden 2021, by downloads
- Basic Statistic Leading news iPhone apps in Norway 2021, by downloads
About the region
10
- Basic Statistic Mobile app developers: location worldwide 2014, by region
- Basic Statistic Google Play: number of available apps 2009-2023
- Premium Statistic Leading iPhone social media apps worldwide 2022, by revenue
- Premium Statistic Leading Amazon Appstore app categories 2024, by number of apps
- Premium Statistic Free and paid app distribution for Android and iOS 2024
- Premium Statistic Average price of paid iOS apps 2024
- Premium Statistic Apple App Store: number of available apps as of Q3 2022
- Basic Statistic Apple App Store: quarterly growth of available apps as 2015-2022
- Premium Statistic Google Play: growth of available apps Q3 2022, by category
- Premium Statistic Apple App Store: growth of available apps Q3 2022, by category
Other regions
10
- Premium Statistic Leading iPhone social media apps in Switzerland 2022, by revenue
- Premium Statistic Leading iPhone social networking apps in Italy 2022, by revenue
- Premium Statistic Leading iPhone social media apps in Great Britain 2022, by revenue
- Premium Statistic Twitter: daily active users in Spain by operative system 2020-2021
- Premium Statistic Leading iPhone social networking apps in Austria 2020, by revenue
- Premium Statistic Leading iPhone social media apps in Germany 2022, by revenue
- Premium Statistic Leading iPhone music apps in Denmark 2020, by downloads
- Basic Statistic Average cost per installation for Android and iOS apps in South Korea 2016
- Premium Statistic Share of ad revenue-generating apps according to app developers 2019
- Premium Statistic Willingness to switch to 5G when available MENA 2019, by country
Related statistics
10
- Premium Statistic Most popular Google Play app categories 2022
- Premium Statistic Leading iPhone apps worldwide 2023, by downloads
- Premium Statistic Leading iPhone entertainment apps in the U.S. 2022, by downloads
- Basic Statistic Leading iPhone apps worldwide 2023, by revenue
- Premium Statistic Leading iPhone entertainment apps worldwide 2022, by downloads
- Premium Statistic Leading iPhone music apps in Germany 2022, by downloads
- Premium Statistic Leading iPhone music apps in Italy 2022, by revenue
- Premium Statistic Leading iPhone music apps in Great Britain 2022, by revenue
- Premium Statistic Leading iPhone shopping apps in the Netherlands 2022, by revenue
- Premium Statistic Leading iPhone apps in Italy 2022, by number of downloads
Further related statistics
5
- Global revenue of the chemical industry 2017-2022, by region
- Gross gambling yield of the gambling industry in Great Britain 2015-2022, by sector
- Consumer spending on music at retail in Great Britain (UK) 2013, by age and retailer
- Global server shipments 2009-2012, by workload
- Revenue forecast for the U.S. toys and games market 2009-2014
Further Content: You might find this interesting as well
Statistics
- Global revenue of the chemical industry 2017-2022, by region
- Gross gambling yield of the gambling industry in Great Britain 2015-2022, by sector
- Consumer spending on music at retail in Great Britain (UK) 2013, by age and retailer
- Global server shipments 2009-2012, by workload
- Revenue forecast for the U.S. toys and games market 2009-2014
42matters. (April 11, 2018). Distribution of Android app developers worldwide as of 1st quarter 2018, by country [Graph]. In Statista. Retrieved June 01, 2024, from https://www.statista.com/statistics/271988/android-app-developer-country/
42matters. "Distribution of Android app developers worldwide as of 1st quarter 2018, by country." Chart. April 11, 2018. Statista. Accessed June 01, 2024. https://www.statista.com/statistics/271988/android-app-developer-country/
42matters. (2018). Distribution of Android app developers worldwide as of 1st quarter 2018, by country. Statista. Statista Inc.. Accessed: June 01, 2024. https://www.statista.com/statistics/271988/android-app-developer-country/
42matters. "Distribution of Android App Developers Worldwide as of 1st Quarter 2018, by Country." Statista, Statista Inc., 11 Apr 2018, https://www.statista.com/statistics/271988/android-app-developer-country/
42matters, Distribution of Android app developers worldwide as of 1st quarter 2018, by country Statista, https://www.statista.com/statistics/271988/android-app-developer-country/ (last visited June 01, 2024)
Distribution of Android app developers worldwide as of 1st quarter 2018, by country [Graph], 42matters, April 11, 2018. [Online]. Available: https://www.statista.com/statistics/271988/android-app-developer-country/